
Text Visual
Review long text data to uncover patterns, sentiments, and context.
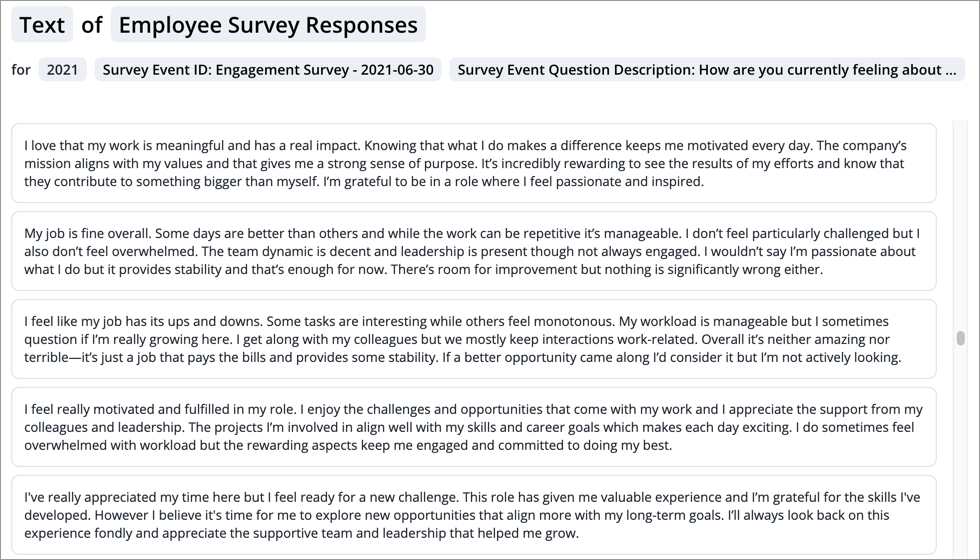
The Text visual shows long text data such as responses from employee surveys, comments from a performance review or job descriptions. Each card in the visual represents text that was received during the selected period.
Text responses can provide context, help validate, and explain quantitative findings. Combining quantitative metrics with qualitative narratives allows for a more comprehensive and compelling understanding of the data. Analyze text to uncover patterns and sentiments for better decisions.
How to explore the visual to gain insight
- In the visual title, select the text you want to analyze. For example, in Visier, all survey responses are contained in Employee Survey Responses.
- Apply the required filters to see the text. Only 1 member can be selected for each required filter.
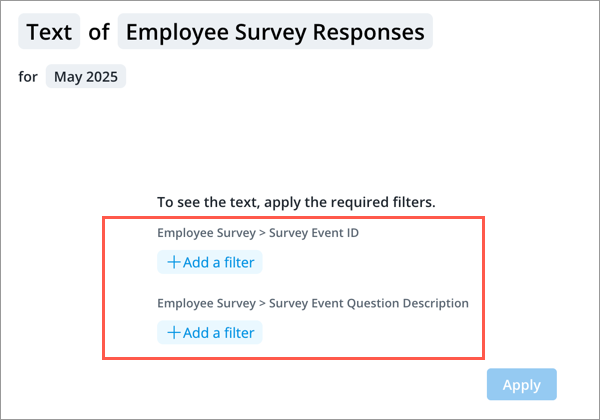
Filtering by the Survey Event ID and Survey Event Question Description attributes allows you to view responses to a specific question within a particular survey. For example, all responses to the question "How are you currently feeling about working at your company?" from the June 30, 2021 engagement survey.
- Use the Time picker to change the time period or granularity based on when the text was received or submitted. In the preceding example, filtering to the year 2021 ensures that responses from the survey distributed on June 30, 2021 are captured.
- If available, click Add a Filter
 on the Analysis Context toolbar to add optional filters and view text for a specific population such as Sales. The available filters are set by your administrator, which may be limited to a predefined list. For more information, see Filters.
Your administrator controls how long text data is analyzed, including the required and optional filters. For configuration details, see Create a Text Concept.
Generate an AI text summary
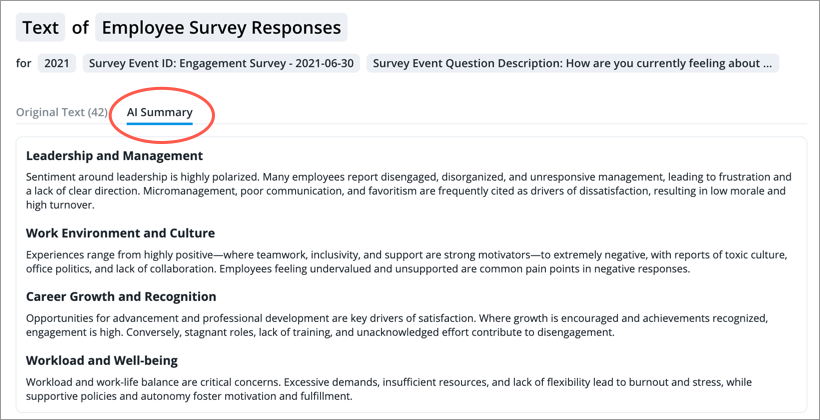
Quickly uncover key themes and make faster, better-informed decisions by generating and displaying an AI summary of long text data.
Note: Limited Availability This feature is in limited availability. If you're interested, please contact your Customer/Partner Success Manager.
Who can use this feature?
Users with the following:
- Permission capabilities: AI Text Summary and Enable AI Explanation
Your organization must also opt in to AI features.
Not sure if you have this feature or capability? Reach out to your administrator.
To generate an AI text summary in Explore or full screen:
- Click the AI Summary tab.
To display the AI text summary as a chart card in an analysis:
- In the Analysis Editor, hover over the card, and click the Edit card appearance button
 .
. -
In the Edit card appearance dialog, in the View card as list, select AI Summary.
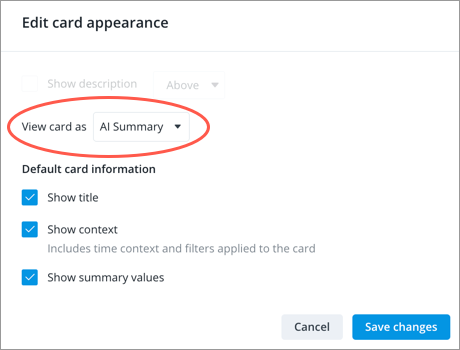
- Click Save changes.
Note:
- Users who do not have the AI Text Summary and Enable AI Explanation permission capabilities will see the original text instead of the summary.
-
When downloading the Text visual as a spreadsheet only the original text will be included.